Upgrade your traditional 3D layout by giving motion to it!
VISUAL PROCESS AND FLOW MANAGEMENT

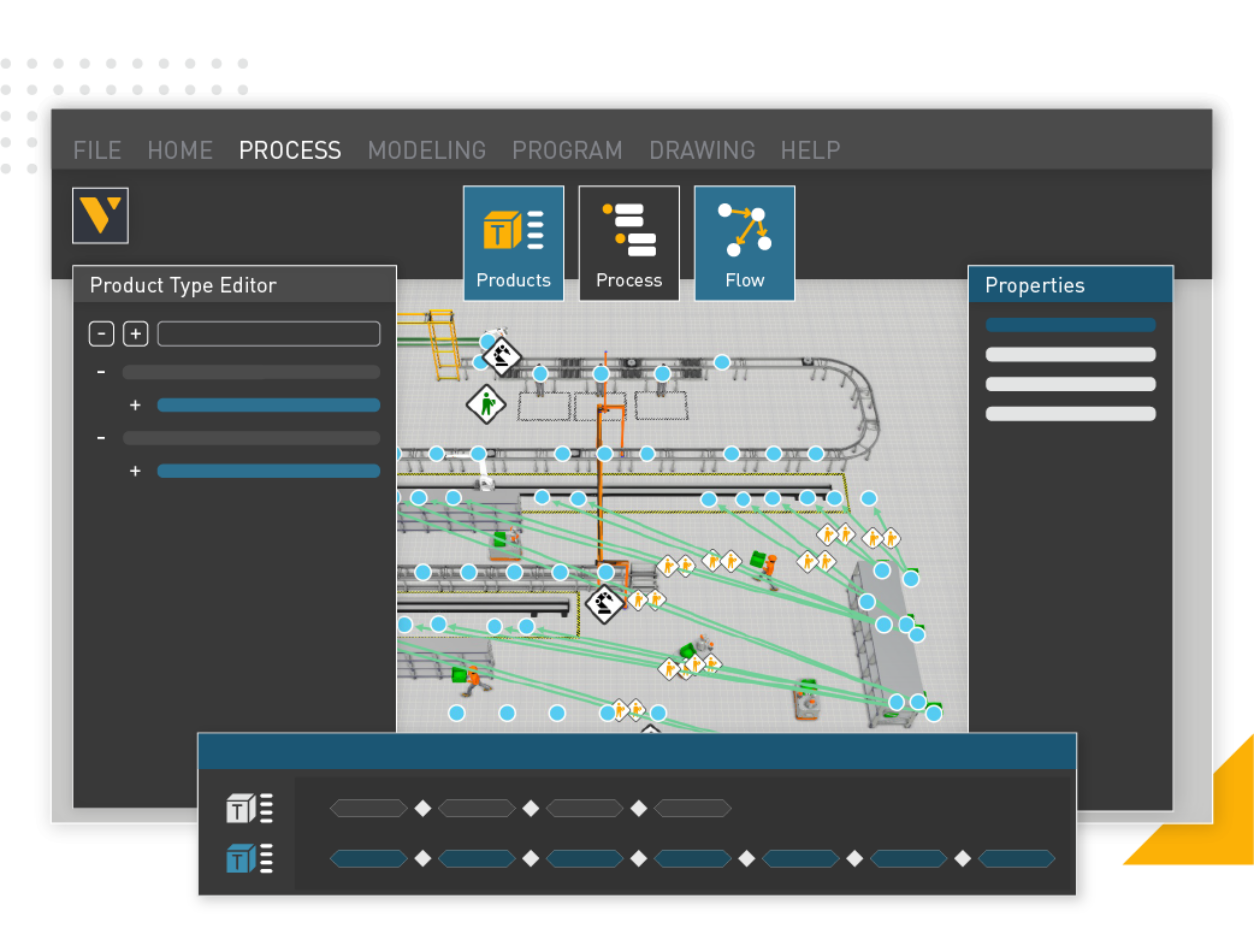
Visually manage processes and production flows in your layout. Processes and flows can be directly managed using the editors or altered directly in the 3D world, making it easy to analyze, troubleshoot, and modify the production logic.
After your 3D layout has been created, simply define the products that are going to travel in your system. Then, it’s just a matter of linking the different process nodes according to where the products are going to travel and you already have a functional simulation. The fine-tuning and customization of the processes and the transports is managed in each link and node set-up windows.
Identify bottlenecks and design errors to improve your process!
STATISTICAL DATA

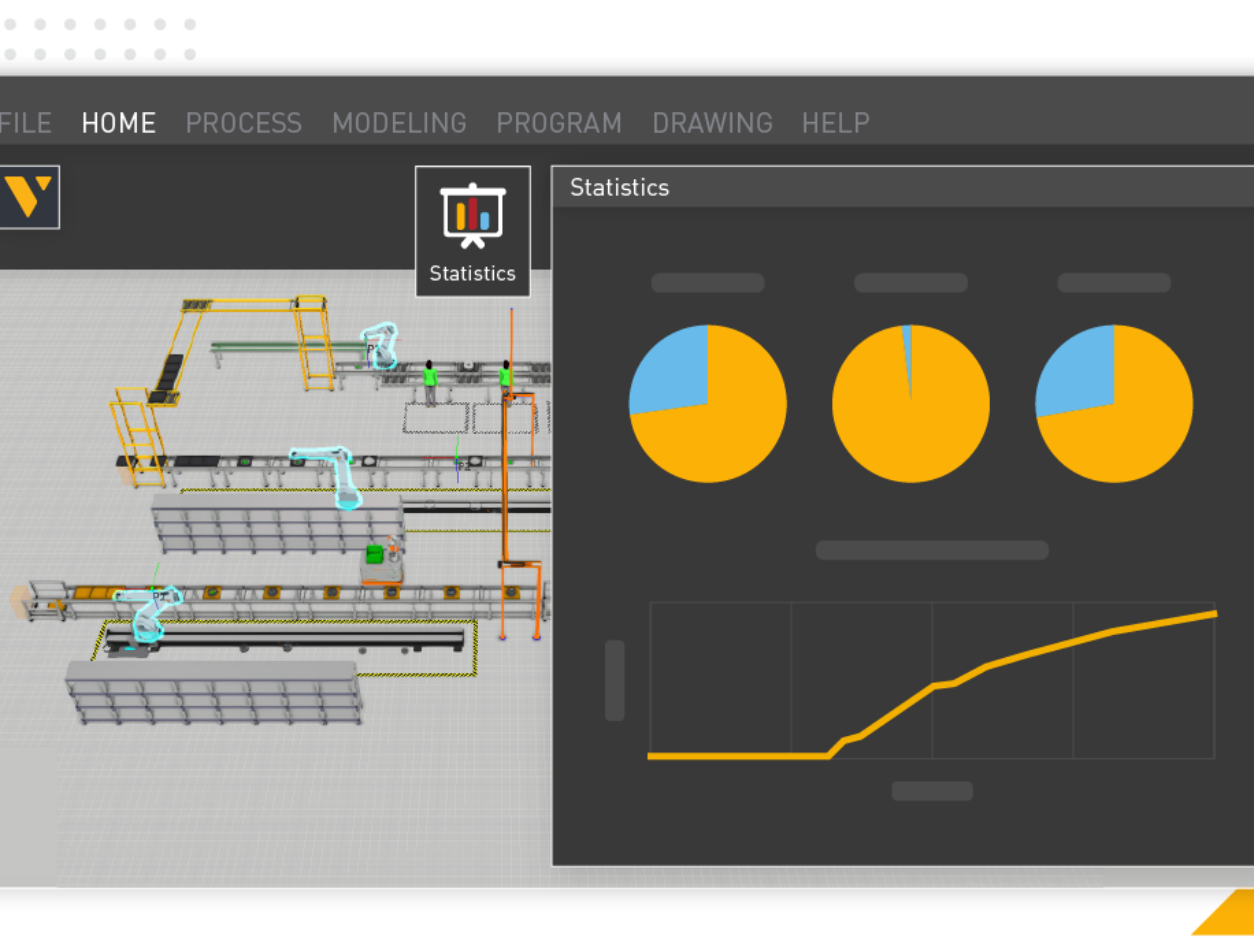
Gather data from the process simulation to visualize statistics using line, area, bar, or pie charts. Create your custom dashboard and easily export your data records in PDF or Excel.
The main difficulty in statistics is to collect statistical data correctly. Just implement Visual Components’ statistical tools once where you want it in your model. Then, all you have to do is change the process parameters to understand and appreciate the optimal set up choices to be adopted in reality.
Here’s a demonstration video of the statistical tools in Visual Components
OTHER POSSIBILITIES


